For the third consecutive year, the Board of Education has compiled the annual student profile highlighting-among other things-the classes New Trier students take, the number of students taking AP classes, and the colleges graduates attend.
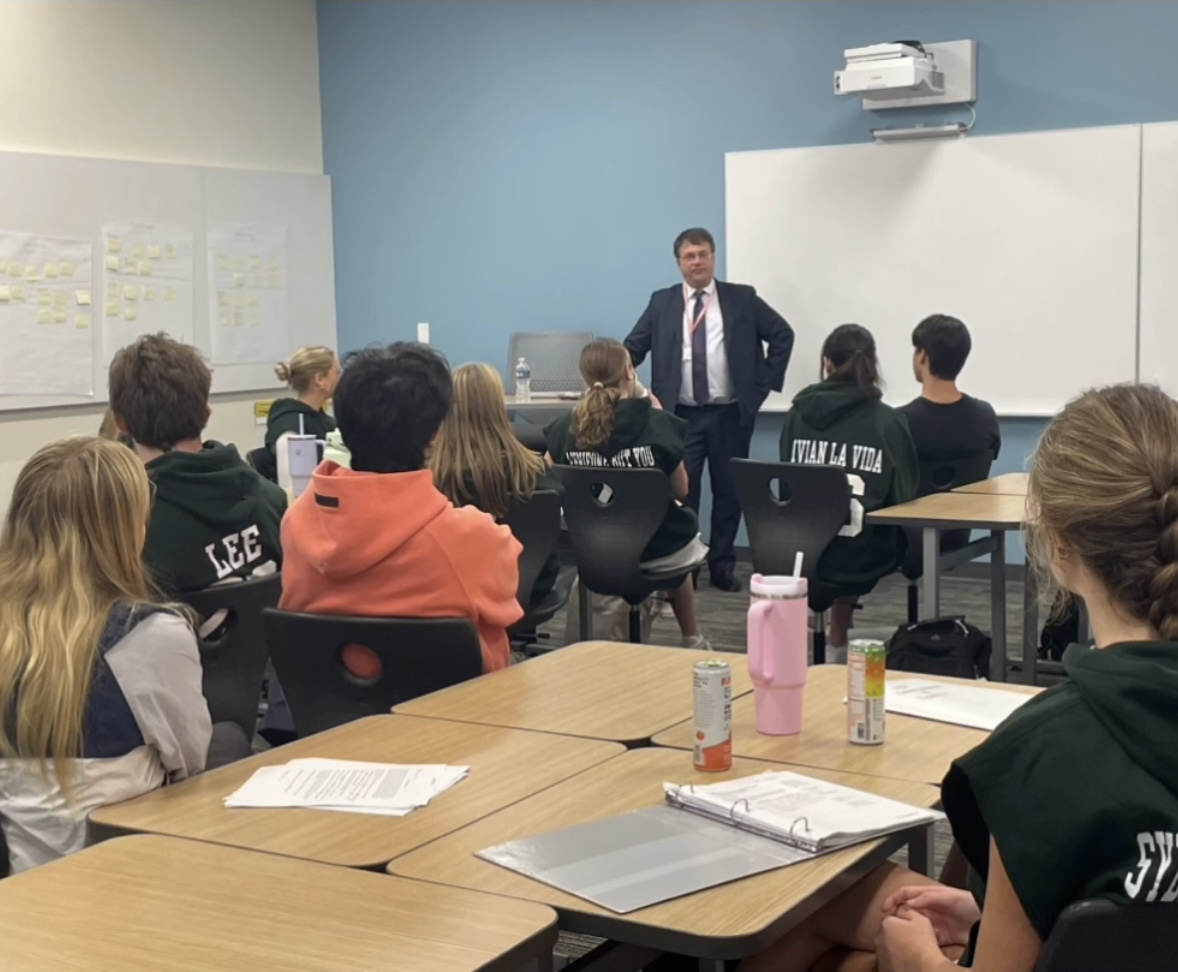
The report is designed to apply this information and to reveal what students do in their four year experience at New Trier. Principal Timothy Dohrer, describes the purpose of the profile as a way to better understand students and trends.
“Our goal with the student profile is primarily to debunk misperceptions at New Trier. It helps explain who we are, and not what people think we are.”
One thing the report tries to clarify is the level system. Among New Trier students last year, only 2.9% took all 4 level courses, only 2.3% took all level 3 courses, and a mere 0.5% were strictly enrolled in just level 2 courses. The rest of the 2012 class (94.3%) took combinations of levels 2, 3, or 4.
“What we really want to get across in the report is that the level system for New Trier is such a broad experience. Rarely do we have students all in one particular level, and we encourage students to find their strengths in certain classes, and fit in with the rigor the class demands,” Dohrer said.
The report also provides insight on students’ experience after 4 years. Those who take predominantly level 3 classes are getting into University of Illinois, Michigan, and Wisconsin. Students who take a combination of levels 2, 3, and 4 are being accepted into Indiana University, Colorado, and Vermont at high rates as well.
“We want to make it clear to students that people are getting into very good schools from not just being in all level fours, but with level 2 and 3 classes as well. Students should not feel that they can’t get into a good college because they aren’t taking all level fours. The data presented in the report refutes that misconception,” Dohrer said.
While Dohrer talked about the report’s significance to students, Assistant Superintendent for Curriculum and Instruction Paul Sally believes the report is an important tool for colleges and how they perceive the school.
Sally said the inclusion of AP test scores is in response to, “a national push that has been to get more students in high school to get into AP classes.”
New Trier AP test scores for AB Calculus, BC Calculus, English Literature, English Language, Biology, U.S. History, and Psychology have all been above the national average. The Board of Education credits this to the instruction of teachers at the AP level, who have prepared students for the test. In the Class of 2012, 1,265 AP students out of 1,590 (81%) scored a 4 or 5 on their AP exams.
Interestingly, while New Trier does hold one of the highest AP test averages in Illinois, the number of students who take AP classes are substantially lower than other public schools like Stevenson.
Sally believes that in terms of the quantity of students taking AP classes, there should be no worries since “our level system has proved to prepare kids with a wide range of ability and learning capabilities and send them off to the colleges they aspire to go to.”
The Class of 2012’s profile covers a range of topics including academic awards earned to course-taking patterns, level profiling data, data on the college admissions, support services that the school provides, participation in extracurricular programs, and service activities.
Among those who composed the student profile are Sally, Assistant Superintendent for Student Services Timothy Hayes, and Superintendent Linda Yonke.
“The student profile was shown to the Board of Education in November, and we presented it to the parents association at the Winnetka Campus just recently [Dec. 5th]. In the future, we look forward to presenting this to the Freshman Class every year to give them a firm understanding of how the level system works and their academic path that lies ahead.”
The PDF file of the report can be found on the New Trier website: http://www.newtrier.k12.il.us/uploadedfiles/files/content/New_Trier_Web_Site/Administration/Board/Annual%20Report%202012.pdf


